Debugging HLSL & GLSL shaders in VS Code
2021-05-20 14:28:08
2021-05-20 14:28:08
SHADERed v1.5.3 ships with a built-in Debug Adapter Protocol (DAP) support. This means that SHADERed's debugger can be accessed by any other IDE/text editor that supports DAP. Though, today I am showcasing this feature solely with VS Code and a newly released VS Code extension.
This extension brings shader debugging to Visual Studio Code. Here's a simple tutorial on how to get started:
To get started, first you need to install the VS Code extension. You can do this directly through Visual Studio Code:
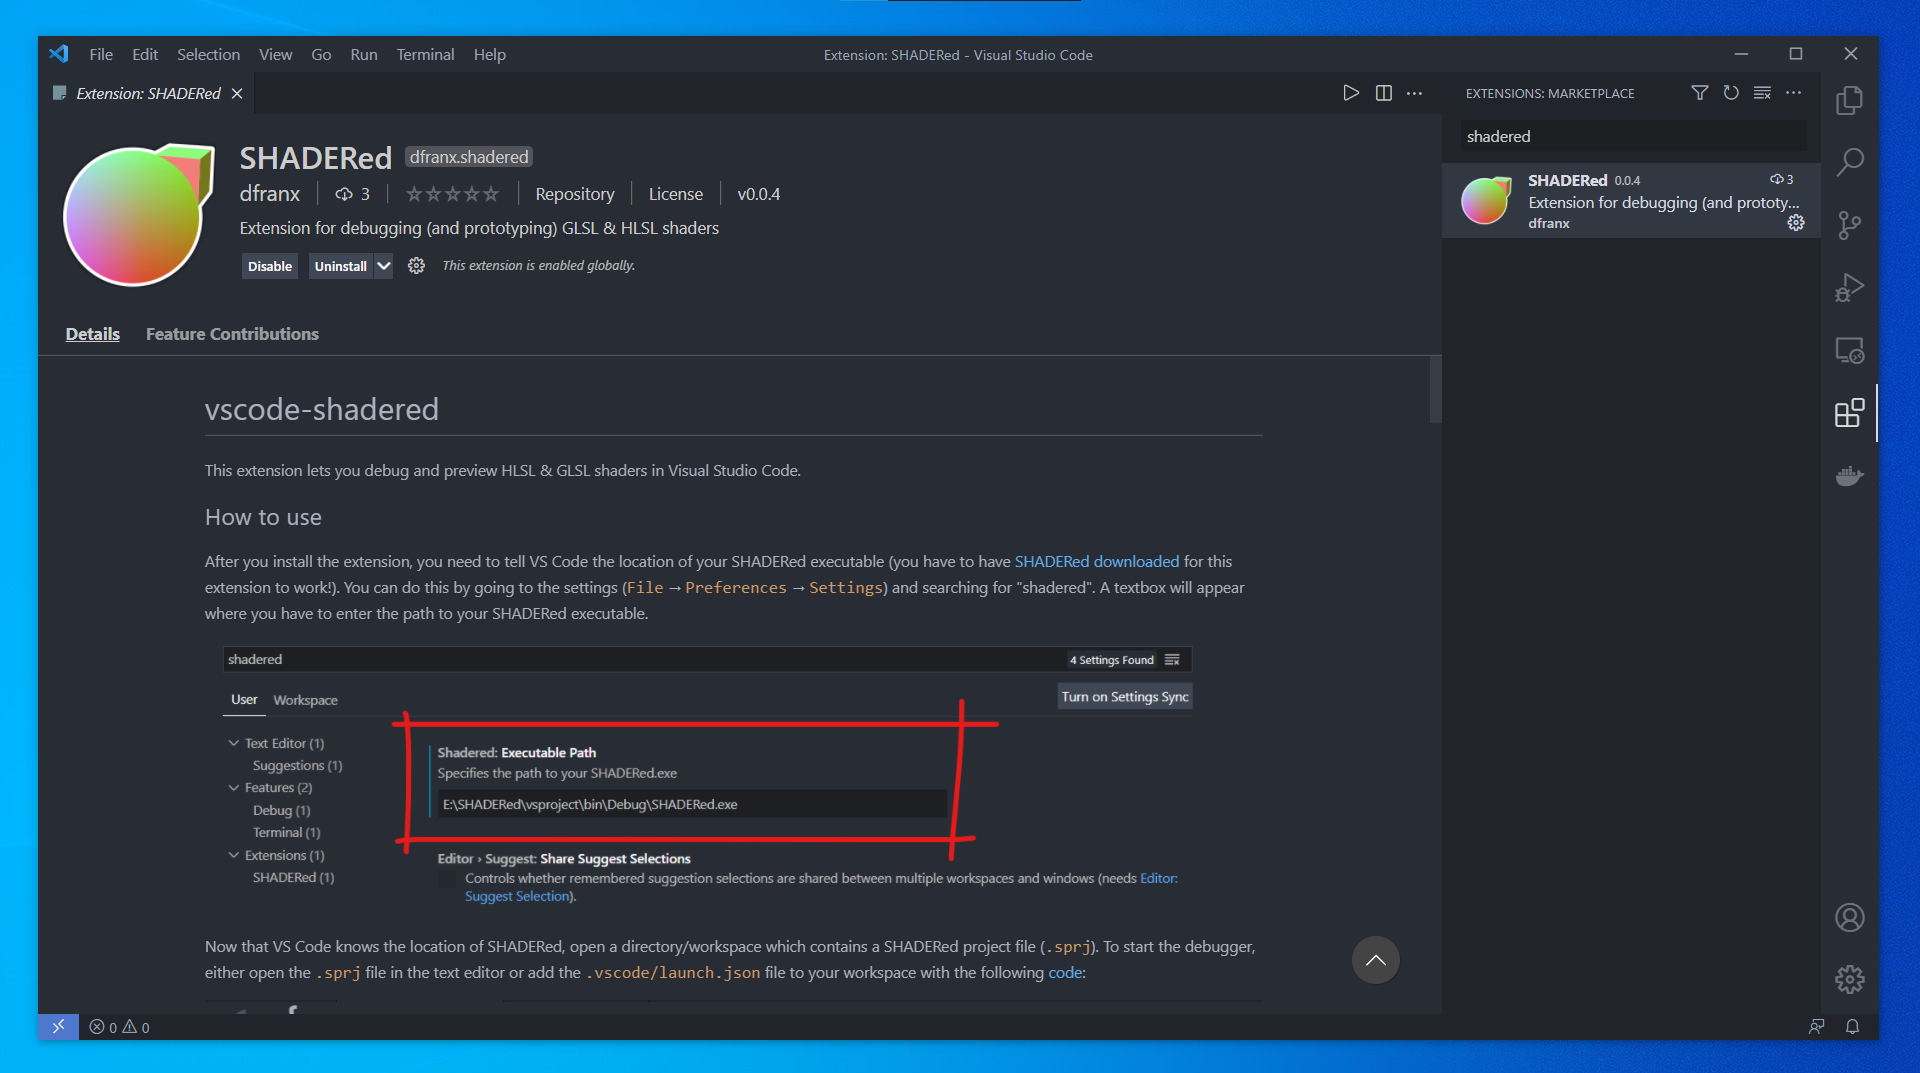
If the extension doesn't show up in the search for some reason, you can go to https://marketplace.visualstudio.com/items?itemName=dfranx.shadered and manually install the plugin or compile it by yourself from the source code: https://github.com/dfranx/vscode-shadered.
Once you've got the extension installed, you need to tell VS Code the location of your SHADERed executable (you have to have SHADERed downloaded for this extension to work!). You can do this by going to the Settings (File → Preferences → Settings) and searching for "shadered". A textbox will appear where you have to enter the path to your SHADERed executable.

Now that VS Code knows the location of SHADERed, open a directory/workspace which contains a SHADERed project file (.sprj). To start the debugger, either open the .sprj file in the text editor or add the .vscode/launch.json file to your workspace with the following code:
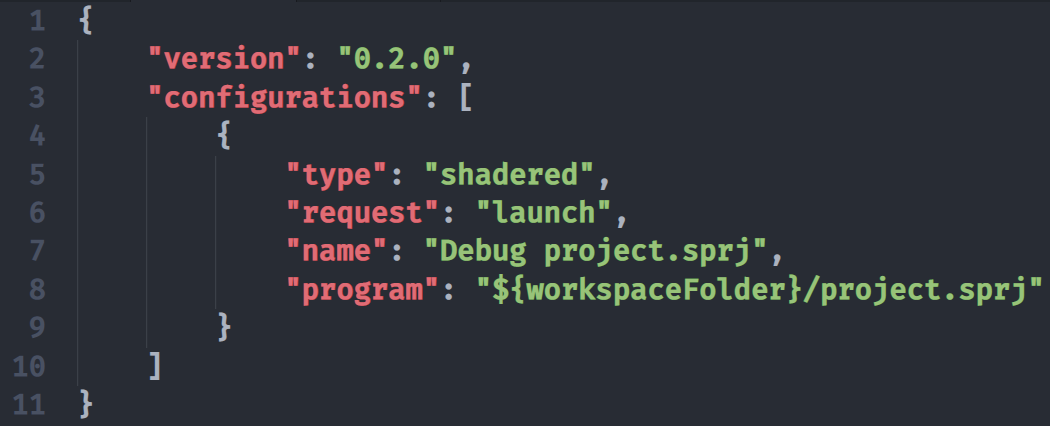
and then press the F5 key. Without the launch.json file, you will always have to change focus to a .sprj file in VS Code before you press the F5 key.
With this extension you can debug both HLSL and GLSL shaders.
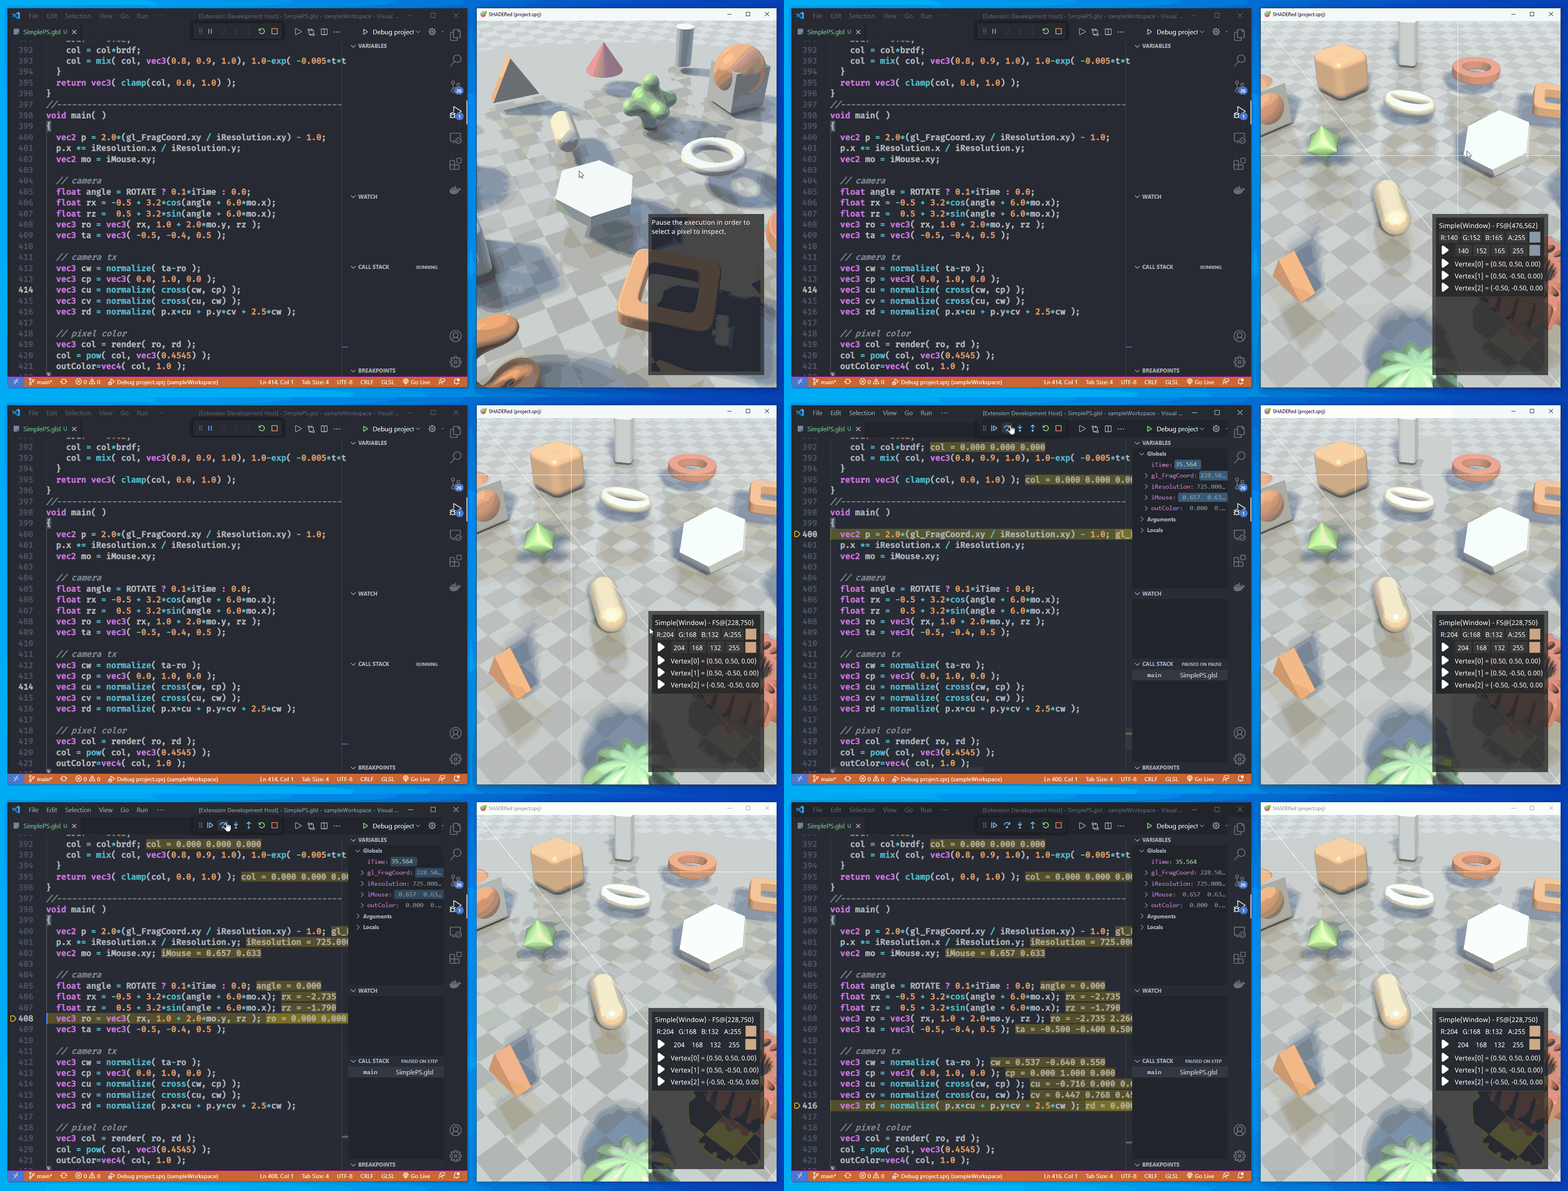
Once you've opened your project, select a pixel by left clicking on it. SHADERed will pause the preview and you will be able to pick the shader stage that you'd like to debug. You can debug vertex, pixel, geometry, compute & tessellation control shaders. To start the actual debugger, click on the "play" button. You will now be able to:
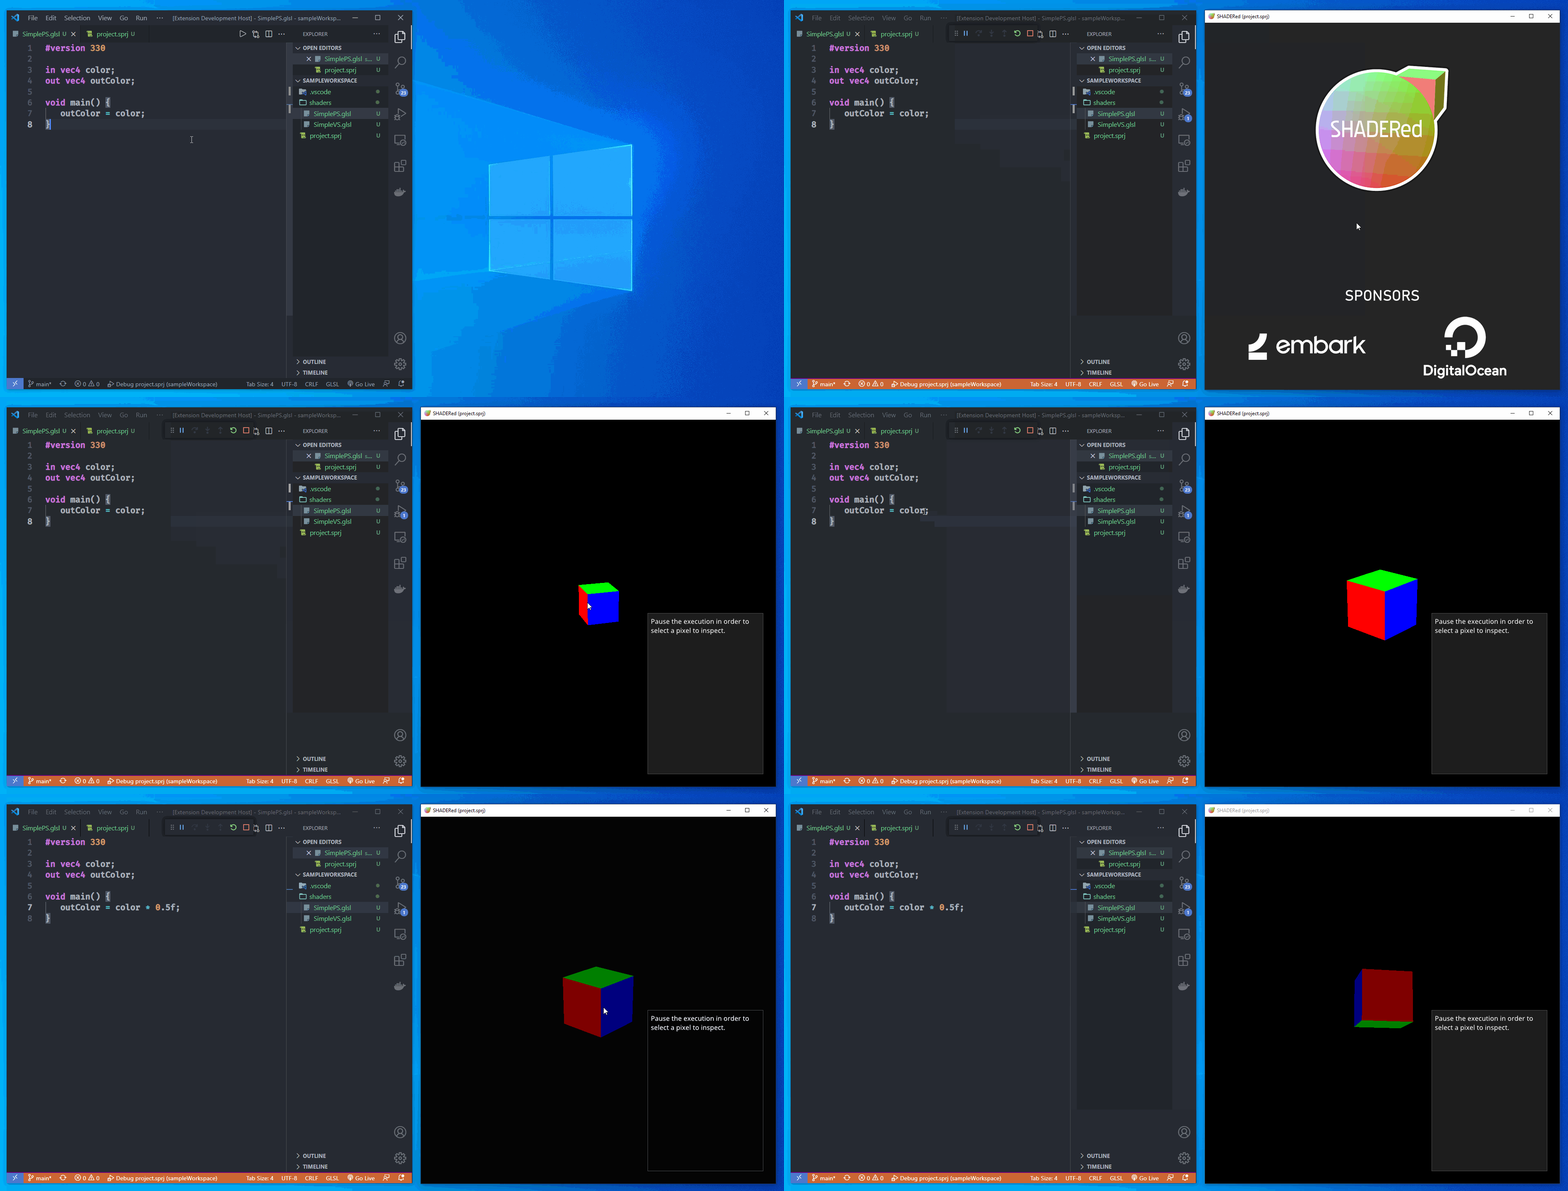
Besides debugging, you can also see your shader's output as you edit the code. When you save your changes to a file, SHADERed will automatically detect them and recompile the shaders.
You can add watches through Visual Studio Code's user interface. Watches will tell you the value of your expression. The value will be updated as you step through your shader's code. You can also see list of all variables and their values.
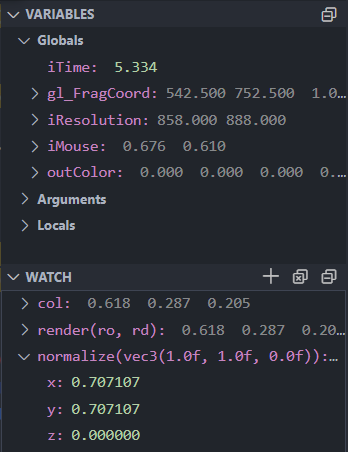
If you want to see the result of an expression without having to add it as a watch, you can enter the custom expressions in VS Code's Debug Console window.

You can add breakpoints to your shaders. The debugger will pause the execution when it hits the breakpoint. These breakpoints can also have a condition (the debugger will only pause when the condition has been met)

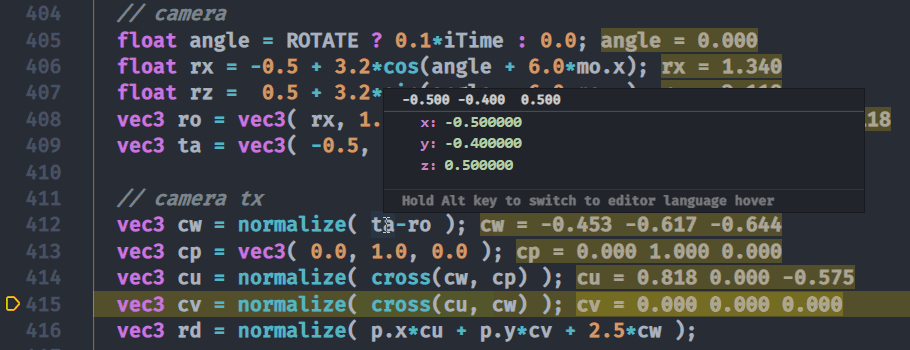
If you've got the "debug.inlineValues" option turned on, VS Code will show variable values next to the each line. You can also hover over a variable's name to see it's value.
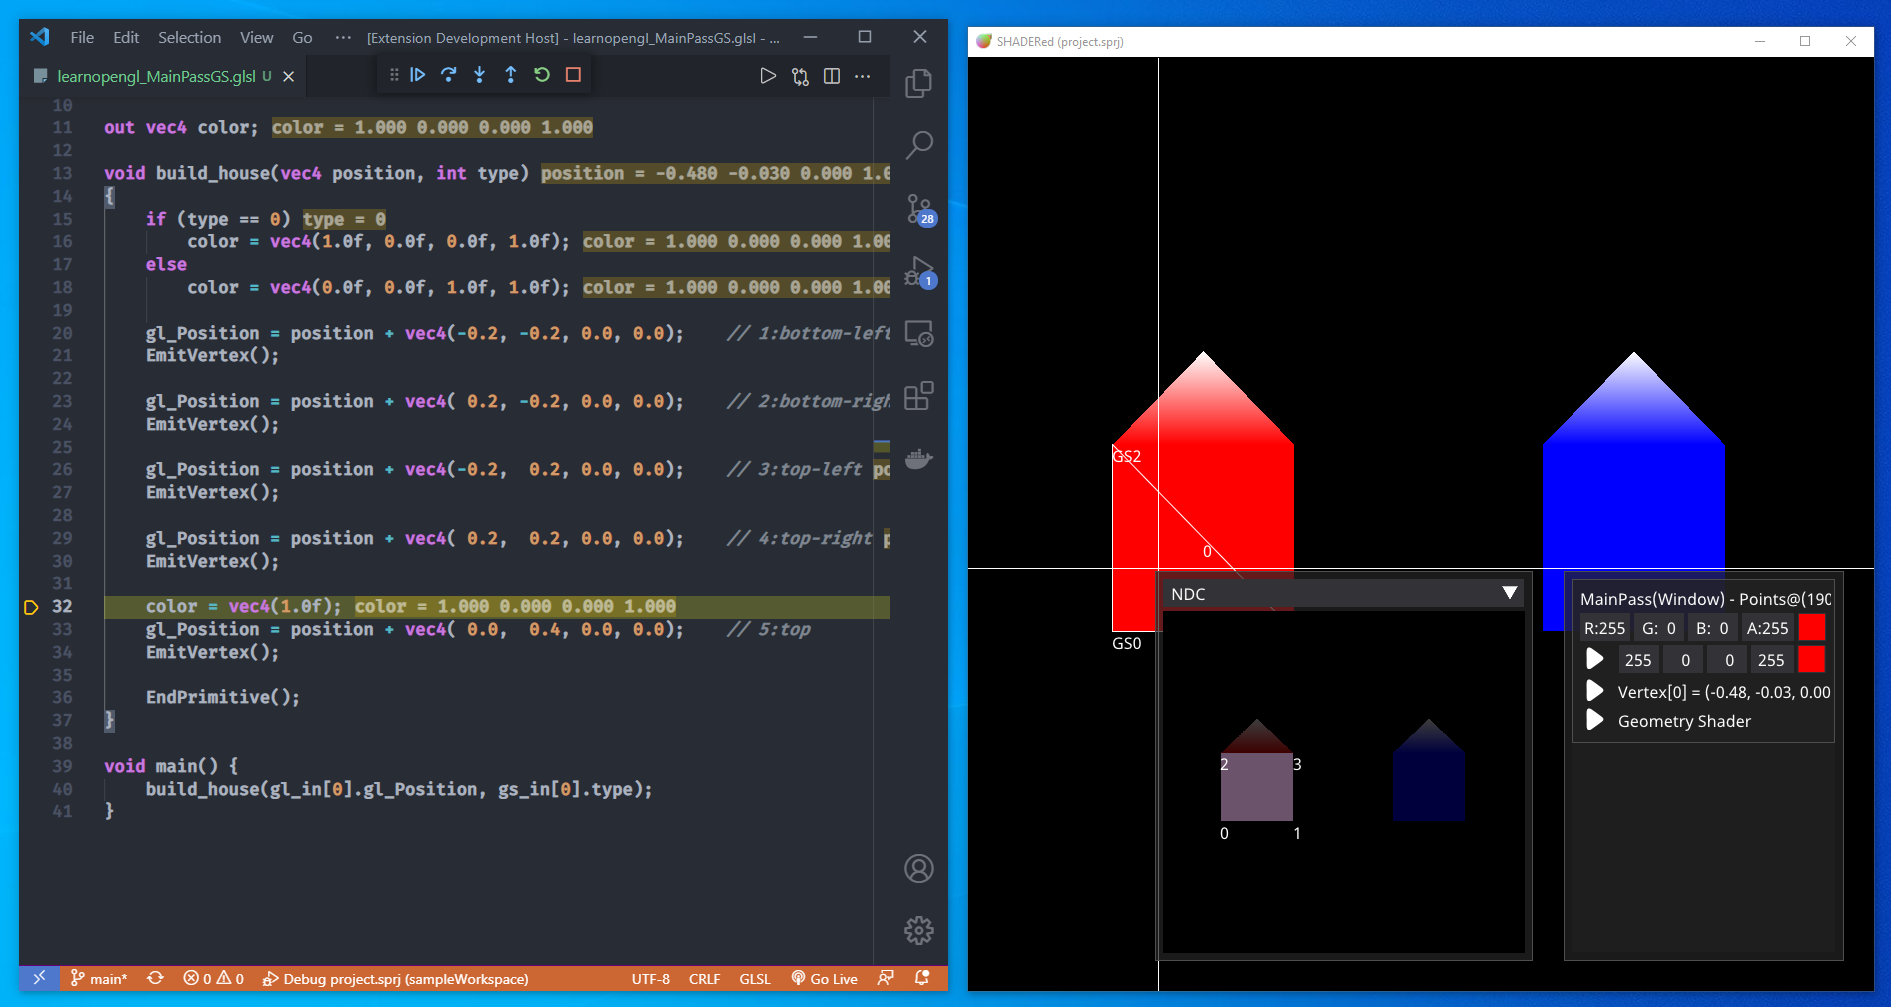
Besides vertex and pixel shaders, you can also debug geometry shaders. A window showing GS output will open when you start the geometry shader debugger.
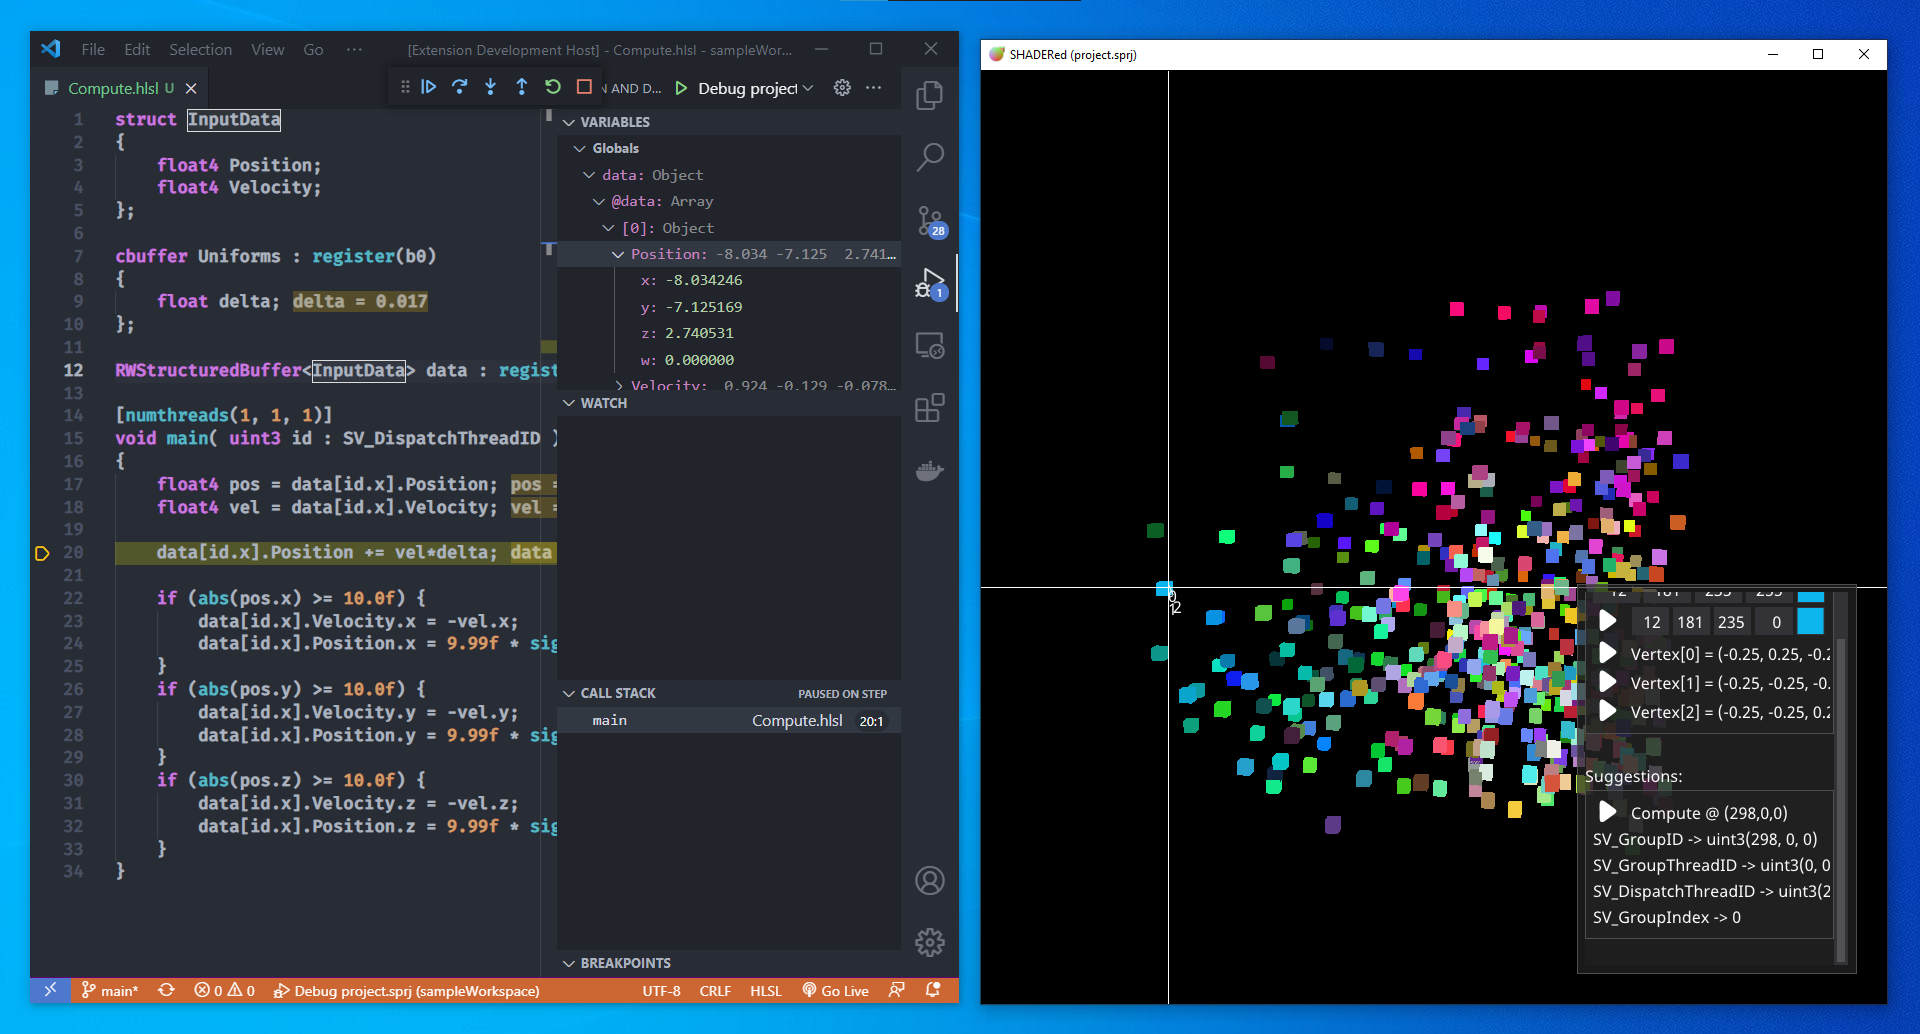
Debugging compute shaders with this extension is somewhat limited. There's currently no way to start debugging a specific thread (though, this can be done through standalone SHADERed). You can only initiate the CS debugger through the so-called "suggestions" (these suggestions are thread ID predictions made by SHADERed):
Before I say what's planned for the next release of SHADERed, I just want to mention again that the DAP support added to SHADERed is in no way specific to VS Code -- SHADERed can now be 'linked' with any other tool that implements DAP.
Here are some of the things I plan to do next:
Not sure when I'll drop the next update since abstracting the renderer will be a lot of work.
If your company uses (and/or likes) SHADERed, please do consider sponsoring the project as SHADERed is completely free & open-source.
I'd also like to mention that SHADERed v1.0 turns 2 years old on June 28th so I'd like to thank everyone for using it, supporting the development, giving feedback, etc... It means a lot! <3